Habitat Complexity Explore Visualizations
Published 20 Aug 2025, Updated 06 Nov 2025
1382
By
Iain R. Caldwell - Lead Data Analyst, MERMAID,
The code in the full resource linked above can be used to recreate or modify the visualizations shown on MERMAID Explore that focus on the habitat complexity protocol. The following three images are examples of those visualizations.
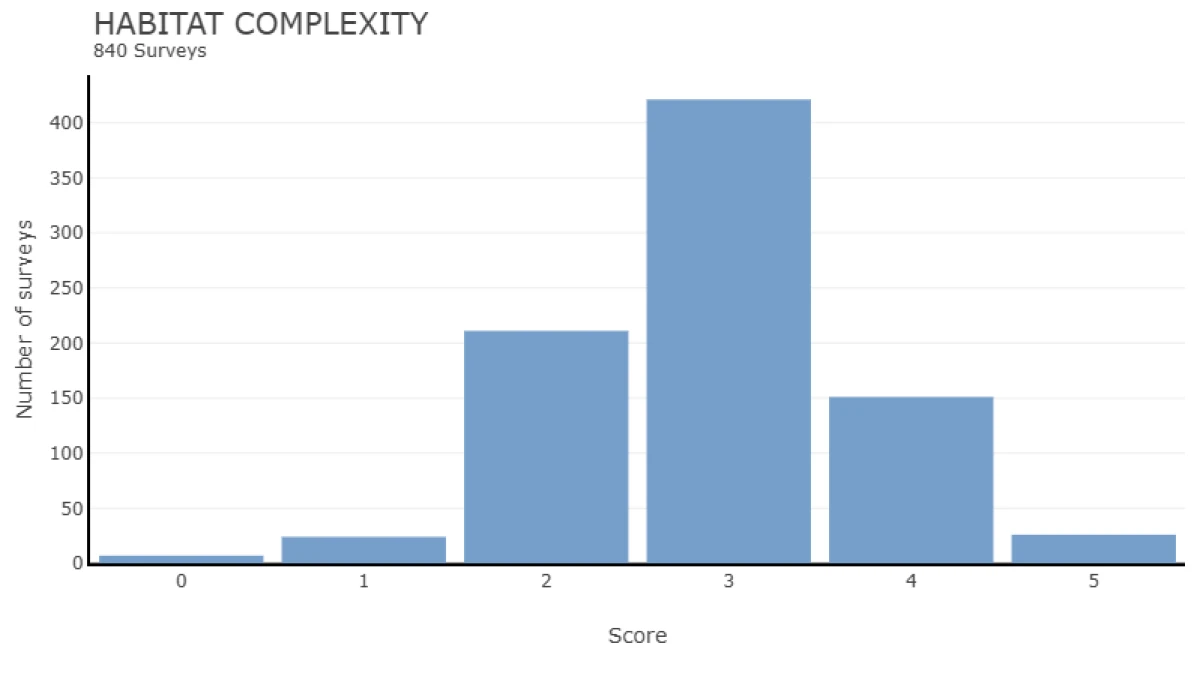
Histogram showing the distribution of habitat complexity scores across all MERMAID summary sample events.
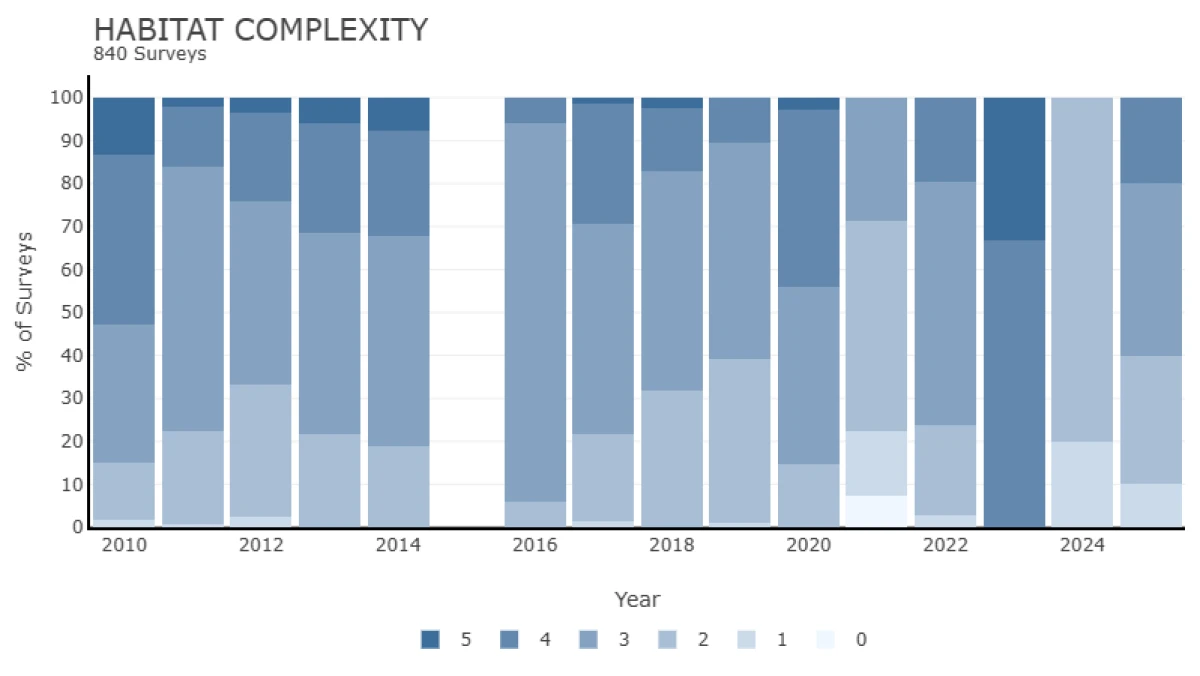
Percentage of surveys with each complexity score each year among all MERMAID summary sample events.
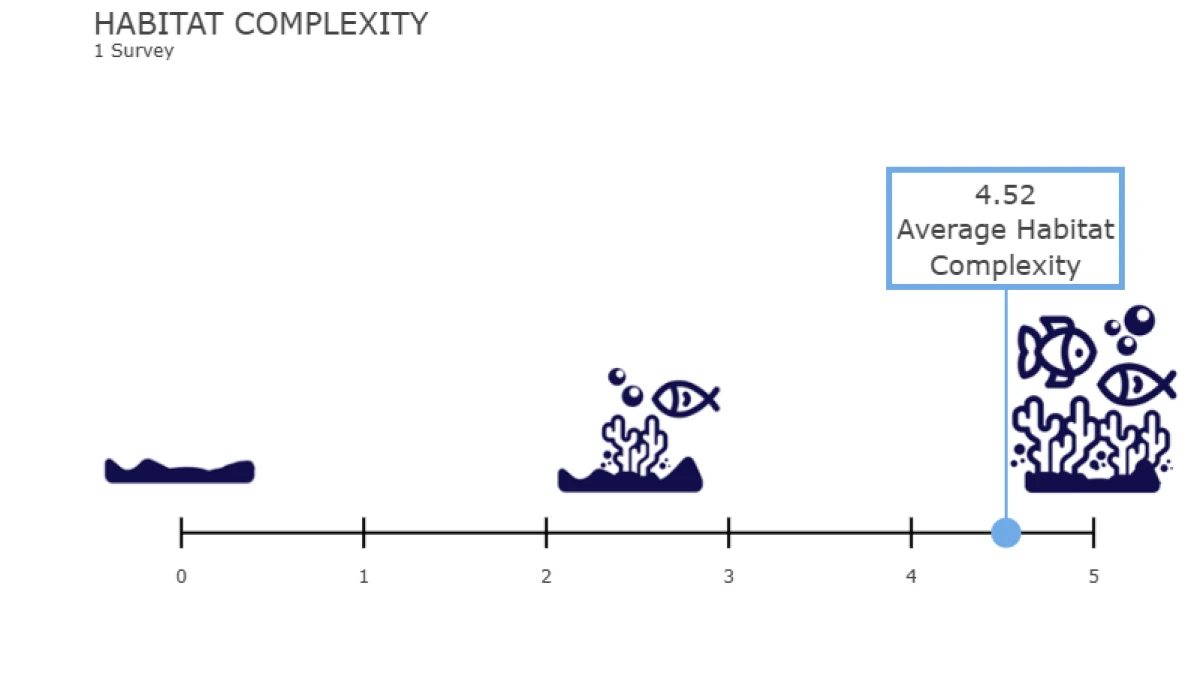
Average habitat complexity for an example MERMAID single sample event.